Ninety days ago I stopped trusting the model to remember my corrections and started enforcing them with code that runs whether the model cooperates or not. This week I finally pulled the numbers on whether that worked. I ran them twice to be safe, and the two tools handed me different answers for the same hook. That was the first thing the report taught me, and it wasn’t the worst one.
So this is not a victory lap. The system does real work and it costs almost nothing, and the first thing the data does is catch me. Again.
I’ll take the good news last, because the part that earned the ninety days is the failure the instrument found on its own.
What “ninety days” actually covers
Phase 2 is the version where corrections run as deterministic hooks outside the model, not as memory the model is trusted to read. It went live on the 7th of April. At the time of writing it has been running a bit over ninety days.
The telemetry is younger. The logging line, one record every time a scar fires, didn’t go in until the 25th of April. So the hard data below covers about seventy-five days, not ninety. I’m saying that out loud because the honest alternative to a round number in a title is admitting what the round number leaves out. Ninety days of enforcement. Seventy-five days of watching it.
In that window: 5,540 fires and 11,963 opportunities on disk. Of the fires, 3,549 belong to the correction scars themselves. The rest are routers and session hooks that share the same logging line, and they get dropped from the scar tables on purpose. Everything below is over that window.
The number I’d rather not publish
The busiest hook in the system is scar_004. Its whole job is to make me open the relevant knowledge base before I generate a recommendation in a domain where I’ve already written things down. It fired 1,550 times. A quarter of all scar fires. By volume, the workhorse.
For most of those I can’t say what happened next, because they predate the instrumentation that records whether I actually went and read the file. But from the 12th of June the hook logs that too. And for the 451 fires where the outcome is measurable, here is the split. 170 times I expanded and read the source. 281 times I fired the hook and generated anyway.
That is a 62.3% non-compliance rate on the system’s busiest correction.
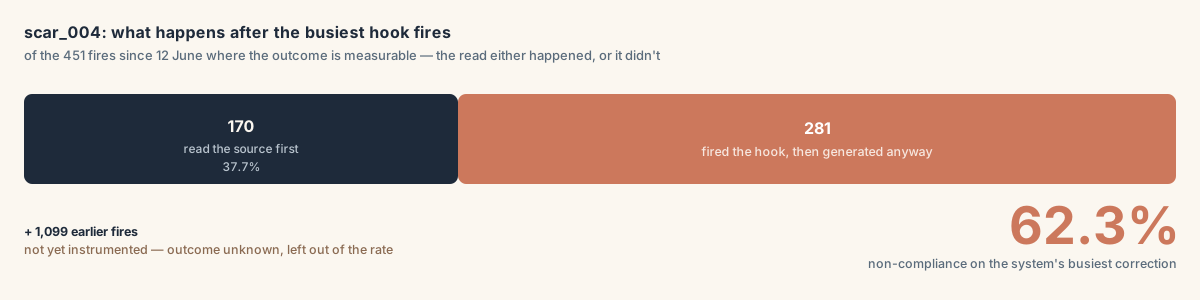
Read it the way I had to. The hook works. It fires, every time, on the right trigger. But the correction it carries is a suggestion, and the model can step around a suggestion. Two times out of three, it does. This is the exact failure the whole series is about, and it showed up inside the enforcement layer I built to stop it. A hook that surfaces a recommendation is still Layer 3 wearing a Layer 4 costume. It puts the right thing in front of the model and hopes. Sixty-two percent of the time, the hope is misplaced.
I’ve said before that the first thing the data caught was me. Same lesson, harder number. The scar isn’t the win. The scar is the smoke, and the fire is a habit of mine that a soft correction doesn’t put out. The fix is not a louder suggestion. It’s making the read happen before generation instead of asking for it nicely. That is the change the monthly pass now carries: turn scar_004 from advice into an action.
The hooks that do work, and the fine print on “work”
Not everything is scar_004.
scar_002 forces a self-review pass on large code writes. Of the fires I could classify, it prevented the error 100% of the time, with zero false positives. That is the shape you want. It fires, and the thing it guards against doesn’t happen.
Here is the whole board over the instrumented window. Every rate is over the fires that got a classified outcome, never over all of them, and that distinction is the rest of this post.
| Hook | What it guards | Fires | Classified | Prevented | Leaked (fired, then ignored) |
|---|---|---|---|---|---|
scar_002 | self-review on large code writes | 351 | 282 | 100% | 0% |
scar_004 | read the KB before generating | 1,550 | 451 | 38% | 62% |
scar_010 | positive framing in brand copy | 136 | 89 | 99% | 0% |
scar_001 | fix accents in generated docs | 157 | 63 | 86% | 0% |
scar_011 | accents in public deliverables | 86 | 27 | 100% | 0% |
scar_005 | subagent reports its coverage | 1,140 | 0 | — | — |
scar_001 also carries a 14% false-positive rate, the only one above zero. And scar_005 fires more than any hook but scar_004, yet I still can’t tell you whether a single one of those fires prevented anything, because it has no outcome heuristic yet. That blank is the most honest cell in the table.
Now the fine print, and the fine print is the reason this post exists. That 100% is over the 282 fires whose outcome I could actually classify, not over all 351. The other 69 are unknown: the file was gone, or the fire predates the outcome logic. And the coverage figure that says the hook catches 97.5% of its opportunities is computed over the 74% of opportunities I validated, not over every one.
Hold onto that, because it is the real subject.
Two of my own tools disagreed about the same number
Here is the part that made me uncomfortable.
When I pulled the numbers, I ran them two ways: the standalone analyzer and the monthly dashboard. They gave me different prevention rates for the same hook. One said scar_002 prevented 80% of the time. The other said 100%. Same data, same window, same hook.
The gap was a denominator. One tool divided the prevented count by every fire, unknowns included. The other divided by fires that had a classified outcome. And unknown isn’t a result. It means “I couldn’t tell what happened,” not “nothing was prevented.” Fold it into the denominator and you don’t get a cautious number, you get a wrong one. A real 100% dragged down to a fake 80% and dressed up as caution.
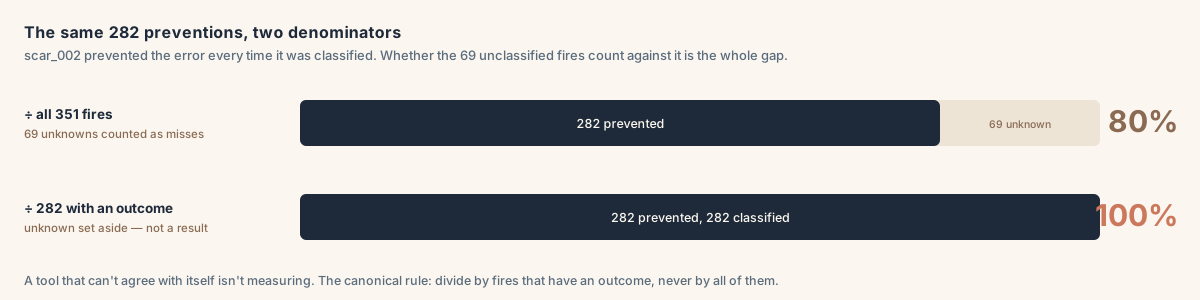
A tool that can’t agree with itself about a number isn’t measuring. It is generating plausible figures. So before writing another line I did the boring thing. I wrote down the canonical definition of every metric, with prevention, false-positive and leak rates all conditioned on fires that have an outcome, and coverage always reported next to the fraction of opportunities I validated. Then I made both tools emit exactly that. They reconcile now. The 80% is gone.
The lesson underneath sits one level up. The layer that measures whether your corrections hold is itself a system, and it drifts, and it drifts in the direction that flatters you until you force it not to. Measuring honestly isn’t something you do once. It is a rule you encode.
Coverage, and what it isn’t
The most tempting sentence in a report like this is “the hooks catch 97% of their opportunities.” Tempting because one coverage number really is 97.5%. It also doesn’t mean what it sounds like.
Coverage here is: of the opportunities I could validate, what fraction the hook caught. For scar_004, only about 34% of opportunities are validated, so its coverage is a claim about a third of the population. The true recall, how many real opportunities the observer never logged at all, I can’t measure without hand-labeling every session, and I haven’t. The protocol admitted this back in April. So the honest phrasing carries the fence every time: “of the opportunities I could validate.” The version that drops those words is lying by rounding.
| Hook | Coverage | …of the opportunities I validated |
|---|---|---|
scar_002 | 97.5% | 74% |
scar_004 | 86% | 34% |
scar_011 | 10% | 49% |
scar_010 | 31% | 40% |
The right-hand column is the fence. scar_004’s 86% is a claim about the third of its opportunities I could check, not about all of them. And the number I genuinely can’t produce, the one for the opportunities the observer never logged in the first place, isn’t in this table because I can’t measure it yet.
I’d rather ship a fenced number than a bigger one with nothing holding it up.
The month the dashboard stayed green over a corpse
The best evidence that this is a production system and not a lab toy is that it broke in production, and the monthly pass caught the break while the live dashboard was still flashing all-clear.
On the 1st of July the automated audit ran and found the classification layer, the piece that uses a small model to sort the ambiguous cases, returning an auth error on every call. A hundred out of a hundred. Dead. And at that exact moment the dashboard read “Health flags: none, all OK,” because the dashboard had no check for whether the classifier was even authenticating. The thing whose job is to watch the corrections had a blind spot aimed straight at its own failure.
Two things came out of it. The cause was mine and boring. The classifier reached the model through a subprocess that draws on a separate credit pool from the interactive one, and that pool had run dry. I moved the classification onto the same in-session path everything else uses, no subprocess, no separate pool, and drained the backlog that afternoon. The second thing is a reflex I keep having to relearn. The watcher needs its own watcher. The dashboard now carries a health check for that layer, so the next time it dies it trips a flag instead of hiding behind a green light. A green dashboard was never evidence of health. It was evidence that nothing I had thought to check was failing.
What it costs
For anyone doing the “sure, but the overhead” math: the enforcement layer adds tens of milliseconds per fire and a small amount of injected context, both logged. The one place a model does judgment work, sorting the genuinely ambiguous opportunities, has cost about seventy-five cents across the whole window. Not dollars. Cents. The expensive part of this system was never the compute. It was deciding what counts as a data point, which is free and much harder.
What changes, and what doesn’t
The rule the whole shop runs on is mechanism, not catalog. A failure that repeats isn’t a limitation you write down and live with. It is a missing mechanism. So the ninety-day report doesn’t close with a list of known issues. It closes with three changes.
scar_004 stops suggesting and starts acting, so the read happens before generation instead of as advice the model can decline two times out of three. The two reporting tools already agree on the conditioned definitions, so they stop handing me different numbers. And the dashboard now watches its own classification layer, so an auth failure trips a flag instead of a green light.
What I’m not doing is turning any of this into a product. Still no pip install, no login, no remote telemetry. This is the instrumentation of one working engineering office, mine, and the numbers above are a real shop doing real work, not a benchmark I set up to win.
Where this sits
The arc has a spine now. Lucy Syndrome named the problem. From memory to scar argued the fix has to run outside the model. Functional scars shipped the primitive. How you know a correction held built the instrument. This is the first time that instrument had ninety days of the real thing to report on.
What it reports is not that I solved it. It reports that the layer holds where it acts and only hopes where it suggests, and that the honest size of the gap is 62%. Persisting a correction was step one. Measuring whether it held was step two. The next post is the one where the busiest hook stops asking and starts doing, and the 62% is what put it at the top of the list.